
Mental Health Infographics: Design Content People Can Share

Article by
Martin Hogg
I help Private Practice counsellors in the UK set up and grow an ethical Private Practice they love, work with their ideal clients, and earn the income they deserve. All without guesswork and burnout. I have been a private practice counsellor myself for over 20 years, specialising in anger management. I set up a not-for-profit social enterprise, Citizen Coaching and Counselling, which delivers thousands of counselling sessions a year to adults and young people in Birmingham. I am a registered BACP Counsellor and the author of three books, My Anger Coach, My Anxiety Coach and My Relationship Coach. These are available on Amazon.
A mental health infographic can make a difficult subject easier to understand and share. Creating shareable infographics for mental health matters because clear, thoughtful content helps people recognise an idea, remember it and pass it on. The design should support the message, not distract from it.
An effective post needs more than attractive colours. It needs accurate information, readable text and a tone that treats people with care. Get these right, and an infographic can be useful without feeling clinical or preachy.
This guide explains why mental health infographics matter and how to shape their content for real readers. It covers charts, interactive features, wording, photos and colour, with practical ways to make each choice clearer and more accessible. No design degree is needed, and there’s no need to cram an entire wellbeing handbook onto one page.
Key Takeaways
- Choose one clear mental health message so your infographic can raise awareness without trying to explain everything at once.
- Use charts only when they make information easier to understand, and label them clearly so readers can follow the point.
- Shape the content around accurate, relevant facts and include links to further support where they’ll be useful.
- Keep text readable and choose photos and colours that support the message without adding visual clutter.
Why mental health infographic matter?
A clear infographic can make a complex mental health idea easier to share. For example, explain how anxiety can affect daily routines using three simple points. Creating shareable infographics for mental health can support awareness, provided the wording informs rather than labels people or reduces them to a diagnosis.
Canva offers templates and simple export options, while Adobe Express is another tool for social graphics. Either can help you create an image or PDF to download. Choose a format that suits where you’ll share it, then preview the design on a phone before publishing.
For information aimed at a UK audience, use BACP guidance as a professional reference and signpost readers to recognised support, such as NHS mental health information or Mind. Keep general education separate from personal advice. For example, don’t imply that one coping method suits everyone in a graphic about anxiety.
Use photos you created, licensed or have permission to share. Check the licence for each image and font before publishing. If you create a chart, credit its data source beside the graphic. Downloading a file doesn’t automatically give you permission to reuse someone else’s work.
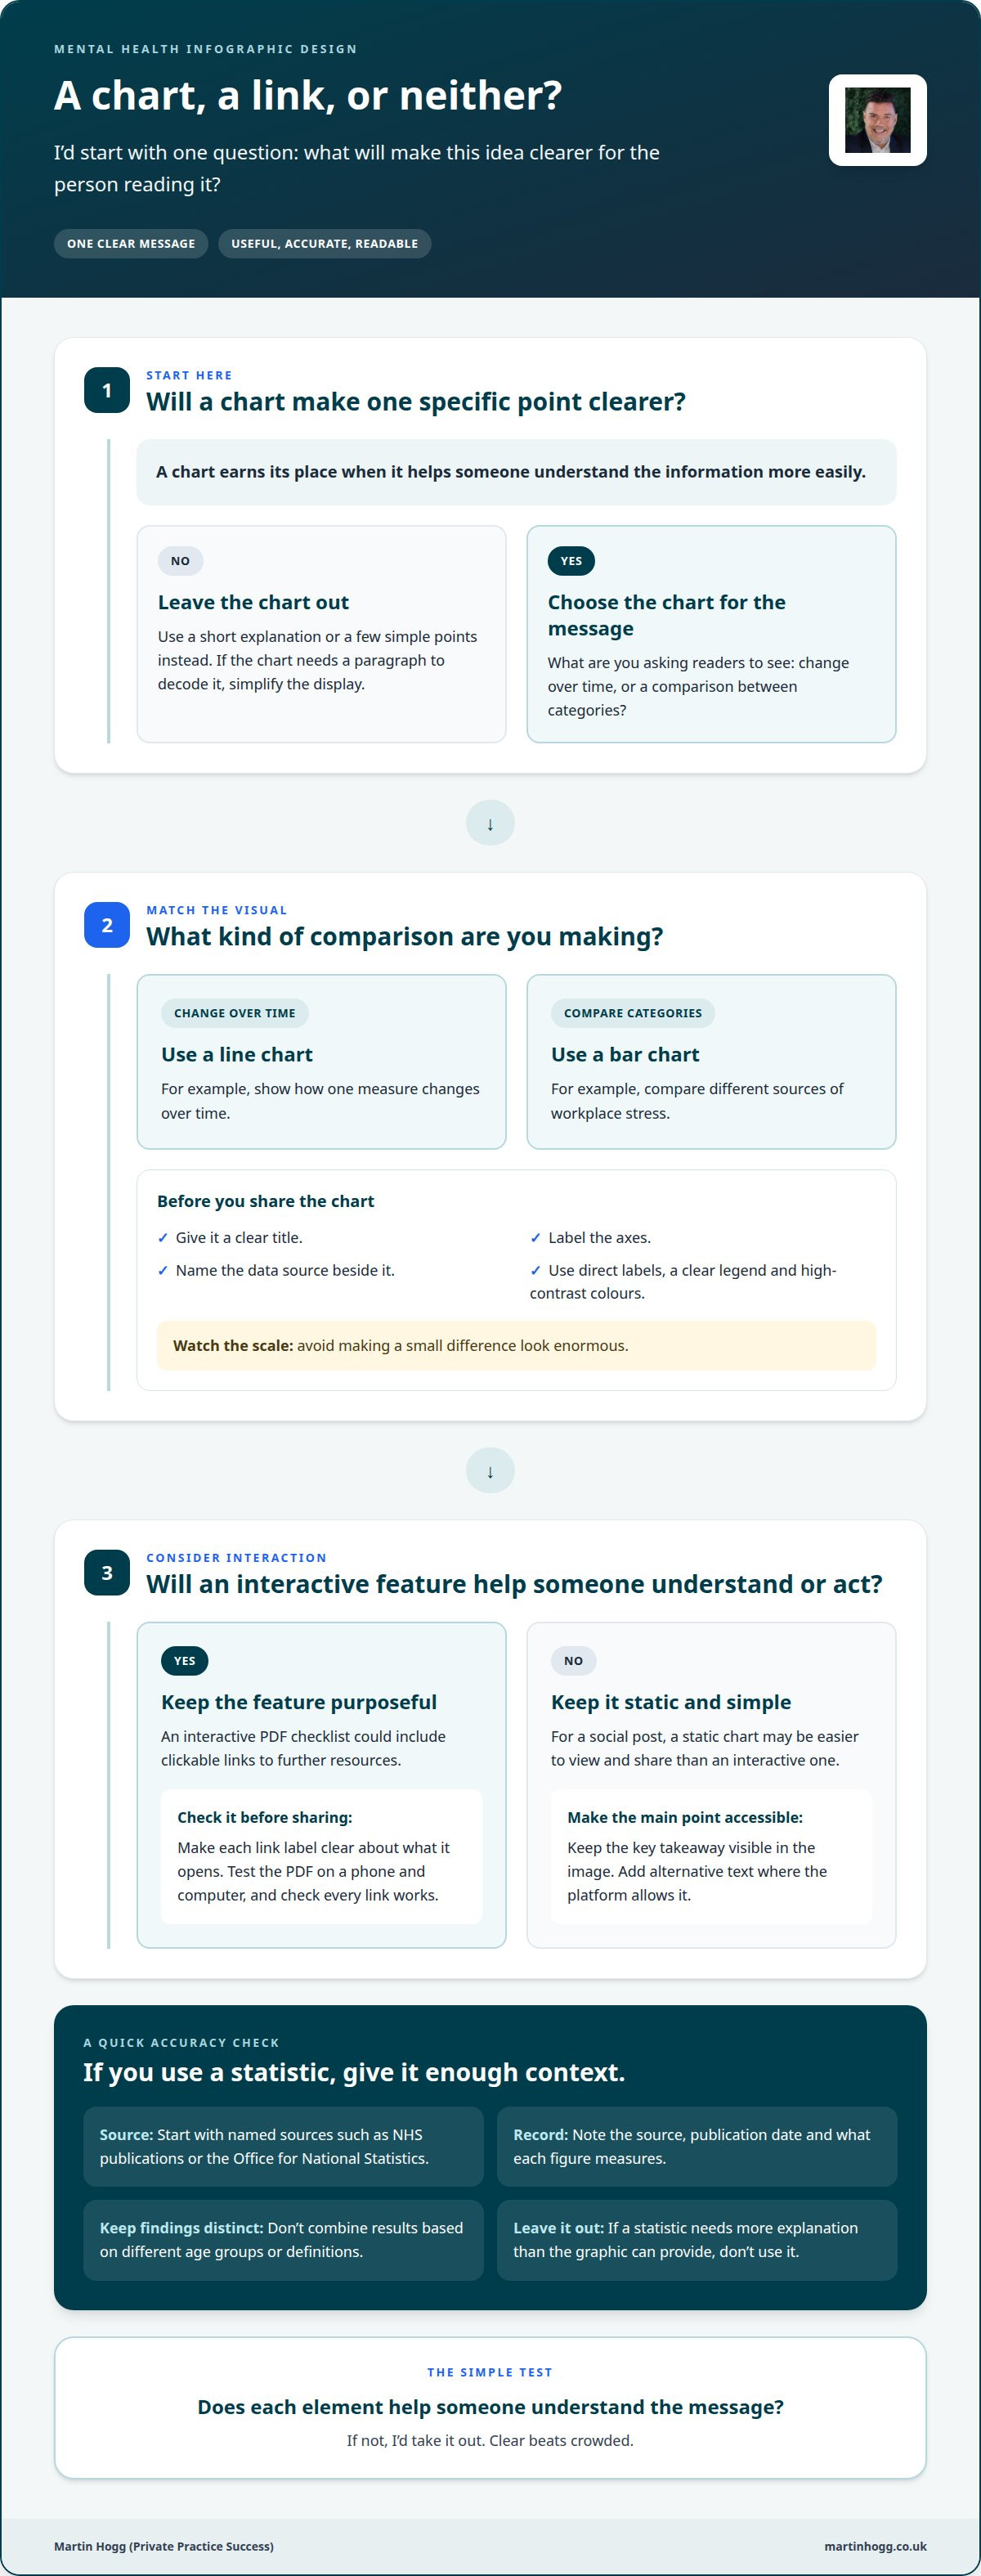
To find reliable UK statistics, start with named sources such as NHS publications or the Office for National Statistics. Record the source, publication date and what each figure measures. Don’t combine findings based on different age groups or definitions. Leave out a statistic if it needs more explanation than the graphic can provide.
For topics such as suicide, self-harm and eating disorders, use calm, non-judgemental wording. Avoid graphic descriptions, methods or images that could cause harm. Focus on where someone can find support, and have a qualified professional review sensitive content before publication.
To assess sharing and understanding, track saves, shares, downloads and link clicks on the platform where you publish. You could also ask a simple question, such as “What is one point you’ll remember?” If readers misunderstand the graphic, revise the wording or layout before sharing it again.
Adding charts, graphs and interactive elements
A chart earns its place when it makes a specific point clearer. A line chart, for example, can show how one measure changes over time. A bar chart can compare categories, such as different sources of workplace stress. Give each chart a clear title, label its axes and name the data source. If readers need a paragraph to decode it, simplify the display.
Match the chart type to your message. Canva is useful for adding a simple chart to a designed graphic. Datawrapper helps create charts for online sharing, while Flourish offers interactive data visualisations. Keep the design focused with direct labels, a clear legend and high-contrast colours. Avoid dramatic scales that make a small difference look enormous.
Interactive features can offer readers a next step without crowding the graphic. An employee mental health checklist saved as an interactive PDF, for example, can include clickable links to further resources. Make each link label clear about what it opens, such as “Find workplace support”. Test the PDF on a phone and computer, and check that every link works before sharing.
For a social post, a static chart may be easier to view and share than an interactive one. Post a simplified chart, then link to a fuller version on a webpage if needed. Keep the key takeaway visible in the image itself. Add alternative text where the platform allows it, so screen-reader users can access the chart’s main point.
I’d ask one question before adding any feature: does it help someone understand or act? Remove decorative icons that compete with the data. If you’re developing mental health content for your practice, a community for private practice support can offer a place to discuss how you present it.
Customising infographic content and design
Start with one useful point backed by accurate information. A headline such as “small steps can support better sleep” gives readers a clear reason to pause. Choose only the facts and visuals needed to explain it. Trying to cover everything at once makes the design harder to follow.
You could focus on recognising signs of stress, explaining a grounding technique or finding support. Keep each infographic to one topic. For example, a graphic about anxiety might explain one coping strategy rather than covering symptoms, causes and treatment together. Put the source beside any statistic, with enough context for readers to understand what it measures.
Shape the content around a useful next step for the reader. Use a short title, clear sections and plain language, with labels close to the facts they explain. A simple flow, such as “notice the feeling, pause, choose a response”, can help readers follow the idea. Read the finished copy aloud and revise anything that sounds stiff.
Plan for where you’ll share the design. Instagram and Facebook posts need a clear message that remains readable on a phone. For TikTok, you could create a sequence of slides that reveals one idea at a time. A printed handout can use a larger layout, with space for source notes and support information. Preview each version before publishing or printing.
Canva can help adapt templates for different social formats, while Adobe Express can create and resize graphics. Keep the wording and visual identity consistent, then adjust the layout for each channel. Check contrast, text size and spacing on a small screen. For print, review a proof to make sure labels and source notes remain legible.
Before finalising, keep the key facts and relevant statistics, and remove details that don’t help explain the topic. Present every statistic in context, and make sure the wording reflects what the information says. Readable text and purposeful visuals make mental health information easier to understand, so avoid crowded layouts and decoration that competes with the message.
Include links to mental health organisations, helplines or educational materials for readers who need further support. Place these details where they’re easy to find, and check they remain legible in each version of the design. This gives readers a way to explore the topic further or seek help.
Customising text, photos and colours
Start with the headline, not the decoration. “Three ways to make a difficult morning easier” gives readers a clear reason to pause. Keep each supporting point short, then read the copy aloud. If a sentence sounds like a leaflet from a filing cabinet, rewrite it in everyday language. Hemingway Editor can flag long sentences, while Canva makes it straightforward to adjust the text layout.
Choose wording that respects people’s experiences. Say “someone living with anxiety” rather than defining them by a diagnosis. Replace vague advice such as “look after yourself” with a concrete example, like taking a short pause between tasks. Don’t imply that a simple tip replaces professional support. A brief source note can identify where clinical information came from.
Choose photos with a clear purpose. A person looking thoughtful may suit a graphic about taking a pause, while staged distress can feel exposing or stereotyped. Use images with permission, and consider whether the people shown reflect the audience you hope to reach. Canva’s stock library can help you find design assets. Check the usage terms before publishing.
For accessibility, use WCAG guidance as a design reference and check text contrast with WebAIM’s Contrast Checker. Add alt text that describes the graphic’s main message rather than every decorative detail. Include essential information in the accompanying post text too, so readers don’t have to rely on the image alone.
Colour can guide attention, but it shouldn’t carry meaning on its own. Pair a colour with a label or icon, such as “pause” beside a shaded panel. Adobe Color can help you build a coordinated palette. Test it in greyscale to see whether sections remain distinct, and avoid pale text over a busy photograph.
Before sharing, preview the design on a phone and ask someone to read it without explanation. If they miss the key point, simplify the copy or layout. One thoughtful edit can make the message easier to understand.
Keep support information clear and easy to find. In the United States, people in crisis can call or text 988 to reach the Suicide & Crisis Lifeline. Place it where it is readable without crowding the design.
Martin Hogg Private Practice Success
At Martin Hogg’s Private Practice Success, I help counsellors build their practice visibility. If you’re considering how mental health content fits your marketing, the Practice Visibility Blueprint offers a structured way to plan your approach. For strategies tailored to your practice, One-to-One Practice Growth Coaching is another option.
You don’t need every post to look perfect. Focus on a clear message and how it connects with the people you want to reach. Start with the audience in mind and the next step you’d like them to take.
Contact Martin Hogg Private Practice Success to discuss what could support your practice.
Make your next message count
Your next infographic doesn’t need to solve every challenge your audience faces. Give it one clear purpose: help someone understand an idea, feel less alone or find a useful next step. That focus also makes creating shareable infographics for mental health more manageable. Start with a question your clients often ask and build one thoughtful post around it.
Then consider how the infographic fits your wider practice. Does the message reflect the people you want to reach? Does it give them a clear sense of what to do next? A small, consistent step can make sharing more purposeful without turning your feed into a full-time design job.
For practical support with your practice visibility, explore the Martin Hogg Private Practice Success community.
Keep it clear and human, and make the next idea simple enough to finish.
Disclaimer
The information provided on this blog is for general informational purposes only. It is also not intended to be a substitute for professional medical or mental health advice, diagnosis, or treatment. Reading this content does not create a therapist-client relationship.


